Pulp Mill Workwear Replenishment: Why Size Ratios Change After the First Issue
Pulp mill workwear replenishment orders that copy the initial rollout size ratio create stockouts in larger sizes and excess inventory in smaller sizes. The root cause: larger garments wear out faster in caustic chemical environments because more fabric area is exposed to black liquor, sodium hydroxide, and chlorine dioxide splash. The result: replacement requests skew toward L, XL, and 2XL within six months — but the replenishment order still reflects the original workforce size distribution. This article covers the wear-rate mechanism that drives size-ratio drift, the replacement-tracking method that quantifies actual consumption by size, and the rebalancing protocol that aligns replenishment orders with real garment life data.
Buyer context
What procurement teams run into
Pulp and paper mills produce kraft pulp, sulfite pulp, and recycled fiber using chemical cooking, bleaching, and paper machine operations. Process area workers — digester operators, blowline technicians, brownstock washers, bleach plant operators, and paper machine crew — wear workwear that is exposed to caustic chemicals (black liquor at pH 13–14, sodium hydroxide solution, chlorine dioxide, hydrogen peroxide) throughout every shift. Chemical splash, aerosol deposition, and contact with wet chemical residues degrade garment fabric, seams, and closures over time. Garments are replaced when fabric thins, seams split, or chemical resistance fails — not on a fixed calendar schedule. The initial workwear rollout sizes the fleet based on the current workforce size distribution: measure every worker, order proportional quantities in each size (S, M, L, XL, 2XL, 3XL), and issue one garment per worker. The size ratio reflects the workforce: for example, 10% S, 25% M, 30% L, 20% XL, 10% 2XL, 5% 3XL. The replenishment order — placed 6–12 months after initial issue to replace worn garments — often copies the same size ratio. The logic: "The workforce hasn't changed, so the size ratio should be the same." But this logic ignores the mechanism that drives differential garment wear by size. **1. Larger garments wear out faster in caustic chemical environments** In a pulp mill process area, garment degradation is driven by chemical exposure area. Larger garments have more fabric surface area exposed to chemical splash, aerosol, and contact: - **Chest and back panels:** A 2XL coverall has 15–20% more chest and back fabric area than an L coverall. Chemical splash and aerosol deposition cover the entire front and back surface. More fabric area means more chemical exposure per garment — the 2XL garment absorbs more chemical contact over its service life than the L garment. - **Sleeve length and circumference:** Larger garments have longer sleeves and wider sleeve circumference. Workers reaching into vessels, handling hoses, and contacting wet surfaces expose sleeve fabric to chemical contact. Longer sleeves contact more chemical residues per task. - **Leg inseam and width:** Larger garments have longer inseams and wider leg openings. Workers walking through wet process areas, kneeling on chemical-contaminated surfaces, and contacting wet pipe surfaces expose leg fabric to chemical degradation. More fabric area means more chemical contact. The result: larger garments reach replacement condition (fabric thinning, seam failure, chemical breakthrough) sooner than smaller garments. A 2XL coverall may reach replacement condition at 4–6 months, while an L coverall of the same fabric reaches replacement condition at 6–9 months, and an M coverall at 8–12 months. The difference is not fabric quality — it is the same fabric in different sizes — but the exposure area that drives degradation rate. **2. The replenishment ratio drift** After 6–12 months of operation, replacement requests skew toward larger sizes. The replacement log shows: - **2XL and 3XL:** 30–40% of replacement requests (despite being 15% of the workforce) - **L and XL:** 35–40% of replacement requests (despite being 50% of the workforce) - **S and M:** 20–25% of replacement requests (despite being 35% of the workforce) The replenishment order that copies the initial ratio (10% S, 25% M, 30% L, 20% XL, 10% 2XL, 5% 3XL) under-orders larger sizes and over-orders smaller sizes. The result: - **Stockouts in L, XL, 2XL:** Workers in larger sizes wait 2–4 weeks for replacement garments while the site waits for the next replenishment order. Workers wear degraded garments beyond safe service life during the stockout period — increasing chemical exposure risk. - **Excess inventory in S, M:** Smaller sizes accumulate in inventory. The site holds 3–6 months of S and M stock that will not be consumed within the next replenishment cycle. Excess inventory ties up working capital and occupies storage space. - **Emergency orders:** The site places emergency orders for larger sizes at premium cost (rush production, air freight) to cover stockouts. Emergency orders cost 20–40% more than planned replenishment orders. **3. The secondary driver: workforce turnover changes size distribution** Pulp mills experience 8–15% annual workforce turnover. New hires may have a different size distribution than the original workforce. If new hires skew toward larger sizes (a common pattern in physically demanding process roles that attract larger workers), the replenishment order that copies the original ratio under-orders larger sizes even further. The workforce size distribution at month 12 is not the same as the distribution at month 0. The replenishment order must reflect the current workforce distribution — not the historical distribution. **4. The procurement mistake: copying the initial ratio** The most common procurement error is to place replenishment orders using the same size ratio as the initial rollout. The logic: "We ordered these ratios for the workforce, and the workforce is the same, so the ratios should be the same." But this logic ignores two factors: - **Differential wear rates by size:** Larger garments wear out faster, so replacement consumption skews toward larger sizes regardless of workforce distribution. - **Workforce turnover:** New hires change the size distribution, so the current workforce distribution differs from the original distribution. The buyer who copies the initial ratio faces stockouts in larger sizes, excess inventory in smaller sizes, and emergency order costs. The buyer who adjusts the ratio based on replacement data aligns replenishment orders with actual consumption patterns — avoiding stockouts, reducing excess inventory, and eliminating emergency orders.
Sourcing approach
How a factory partner can respond
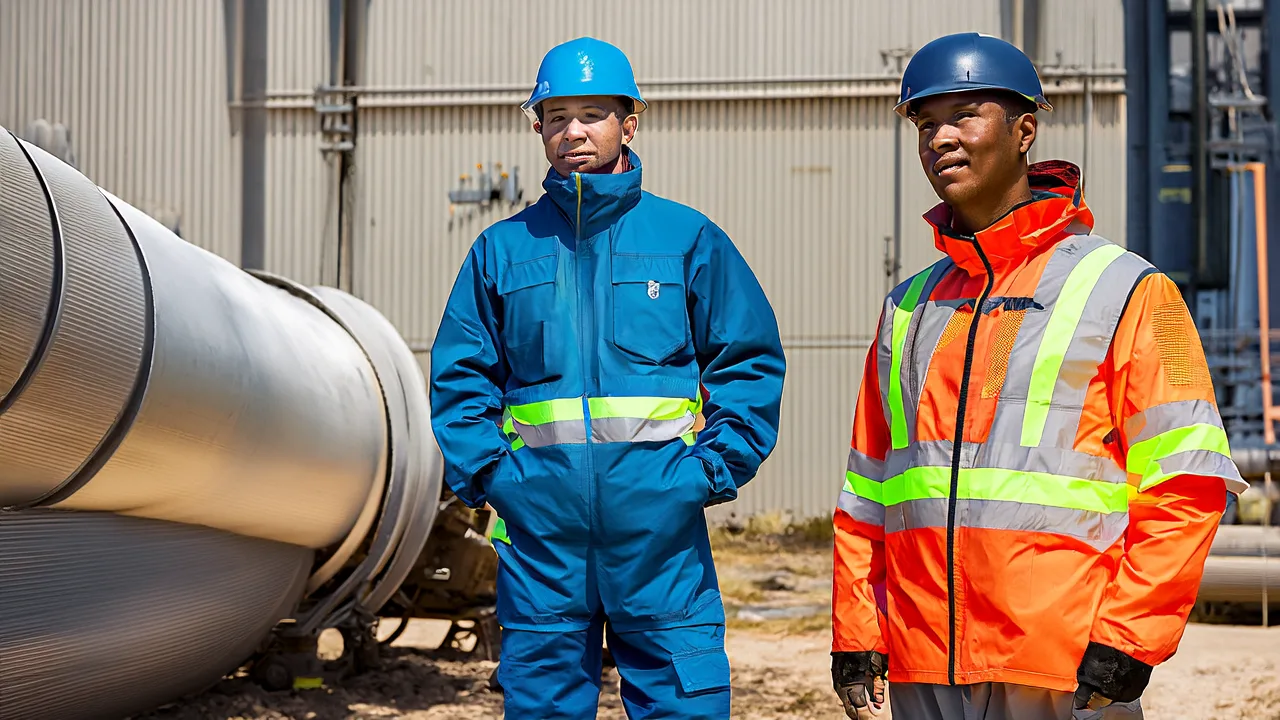
The solution for pulp mill workwear replenishment is to track replacement requests by size over the first 6–12 months, calculate actual consumption rates by size, and adjust replenishment ratios based on real garment life data — not the initial rollout ratio. **Step 1: Implement a replacement-tracking log** Record every garment replacement request with the following data: - **Garment size:** S, M, L, XL, 2XL, 3XL - **Replacement date:** Date the replacement was issued - **Replacement reason:** Fabric thinning, seam failure, chemical breakthrough, physical damage, fit issue - **Worker ID:** The worker receiving the replacement (to track whether the same worker receives multiple replacements) - **Garment age at replacement:** Months since initial issue or last replacement Track replacements for 6–12 months to build a statistically meaningful data set. Minimum data target: 50+ replacement records across all sizes. **Step 2: Calculate consumption rate by size** After 6–12 months of tracking, calculate the consumption rate for each size: - **Consumption rate per size:** (Number of replacements in size X) ÷ (Number of workers in size X) = replacements per worker per year For example: - S: 10 replacements ÷ 15 workers = 0.67 replacements per worker per year - M: 18 replacements ÷ 30 workers = 0.60 replacements per worker per year - L: 35 replacements ÷ 40 workers = 0.88 replacements per worker per year - XL: 28 replacements ÷ 25 workers = 1.12 replacements per worker per year - 2XL: 18 replacements ÷ 12 workers = 1.50 replacements per worker per year - 3XL: 9 replacements ÷ 8 workers = 1.13 replacements per worker per year The consumption rate reveals that larger sizes require more frequent replacement. A 2XL worker receives 2.2× more replacements per year than an M worker — despite wearing the same fabric in the same environment. **Step 3: Calculate adjusted replenishment ratios** Use the consumption rate data to calculate adjusted replenishment ratios: - **Adjusted ratio for size X:** (Consumption rate for size X × Number of workers in size X) ÷ (Total replacements across all sizes) Using the example data: - S: (0.67 × 15) ÷ 118 = 8.5% - M: (0.60 × 30) ÷ 118 = 15.3% - L: (0.88 × 40) ÷ 118 = 29.8% - XL: (1.12 × 25) ÷ 118 = 23.7% - 2XL: (1.50 × 12) ÷ 118 = 15.3% - 3XL: (1.13 × 8) ÷ 118 = 7.7% Compare with the initial ratio: - S: 10% → 8.5% (reduced) - M: 25% → 15.3% (reduced) - L: 30% → 29.8% (similar) - XL: 20% → 23.7% (increased) - 2XL: 10% → 15.3% (increased) - 3XL: 5% → 7.7% (increased) The adjusted ratio shifts volume from S and M to XL, 2XL, and 3XL — matching actual consumption patterns. **Step 4: Implement the adjusted ratio for the next replenishment order** Place the next replenishment order using the adjusted ratio. Monitor stock levels and replacement requests during the replenishment cycle: - **If stockouts persist in larger sizes:** Increase the adjusted ratio for larger sizes by 5–10% (the initial adjustment may have under-corrected if consumption rates are accelerating). - **If excess inventory accumulates in smaller sizes:** Reduce the adjusted ratio for smaller sizes by 5–10% (the initial adjustment may have over-corrected if consumption rates are stabilizing). **Step 5: Rebalance ratios every 6 months** Recalculate consumption rates and adjusted ratios every 6 months using trailing 12-month replacement data. The rebalancing protocol: - **Update workforce size distribution:** Account for new hires, terminations, and role changes that affect the workforce size distribution. - **Update consumption rates:** Recalculate consumption rates using the most recent 12 months of replacement data. - **Adjust ratios:** Recalculate adjusted ratios using updated consumption rates and updated workforce distribution. - **Place replenishment order:** Use the updated adjusted ratio for the next replenishment order. **Step 6: Account for seasonal and operational changes** Pulp mills experience seasonal operational changes (annual maintenance shutdowns, production rate changes, workforce scaling during peak production periods) that affect garment wear rates: - **Maintenance shutdowns:** During annual maintenance shutdowns, workers perform high-exposure tasks (vessel entry, pipe breaking, equipment overhaul) that accelerate garment degradation. Replacement requests increase during and immediately after shutdown periods. Adjust replenishment timing to pre-position larger sizes before shutdown periods. - **Production rate changes:** Higher production rates increase chemical exposure intensity (more frequent splash, higher aerosol concentrations, more contact with wet surfaces). Garment wear rates accelerate during high-production periods. Monitor replacement rates during production upsets and adjust ratios if larger sizes degrade disproportionately faster. **Recommended garments for pulp mill workwear replenishment:** - **Industrial coverall-pro** — specify the coverall for process area workers (digester operators, blowline technicians, brownstock washers, bleach plant operators) who face caustic chemical exposure throughout every shift. The coverall provides full-body protection against black liquor, sodium hydroxide, and chlorine dioxide splash. Specify the coverall with chemical-resistant fabric (inherent chemical-resistant fiber such as modacrylic or aramid blend) and chemical-resistant components (chemical-resistant thread, covered closures, chemical-resistant elastic cuffs). Track replacement requests by size for the coverall and adjust replenishment ratios based on actual consumption data. - **Hi-vis safety jacket** — specify the hi-vis jacket for yard workers, wood handling operators, and outdoor maintenance crew who work near vehicle traffic (loaders, haul trucks, forklifts) in low-light conditions. The hi-vis jacket provides ANSI/ISEA 107 Class 2 or Class 3 visibility compliance. Specify the hi-vis jacket with chemical-resistant outer shell for yard workers who handle wood chips, logs, and pulp bales that contact residual chemicals. Track replacement requests by size for the hi-vis jacket and adjust replenishment ratios based on actual consumption data.
Recommended Products
Products that fit this use case

Industrial Workwear
Industrial Coverall Pro
Hard-wearing one-piece coverall for plant, maintenance, and heavy-duty operations.

Safety Uniform
Hi-Vis Safety Jacket
Reflective safety jacket for high-visibility site operations and road work crews.